
Audio Lab How to
How-to notes for Audio Lab — a USB ADC, a reference tape or test record.
Contents
- Recommended ADC
- Set input level
- Controls
- Align tape-head azimuth
- Check tape wow & flutter
- Check turntable wow & flutter
- Check turntable frequency response
- Set turntable anti-skate
- Align cartridge azimuth with crosstalk
- Check cassette channel balance
- Check turntable channel balance
- Tools
- Calibration
- MCP
Recommended ADC
Audio Lab reads a stereo USB (or other system) audio device on the desktop. You need a class-compliant ADC with line inputs — not the laptop or phone microphone.
- Behringer U-Phoria UMC202HD — combo inputs with a LINE pad; set them to line, not instrument or mic.
- Behringer UCA202 / UCA222 — cheap RCA line-in, no mic preamp in the way. Fine for a tape deck or a phono stage. Some units need −1 sample on Channel B trim on the Source tab. It can appear and disappear. Confirm with one output from a source into both ADC inputs — X-Y should be a perfect line.
- Any other 2-in USB interface with a LINE pad (Focusrite Scarlett 2i2 and similar) works if you set the inputs to line.
- 48 kHz is enough for most purposes. Max frequency tracks the open device’s Nyquist.
- On Windows, Playback and Recording for that interface must use the same shared sample rate if you run Live input and Tools / Analyzer output together — see Matched sample rates (Windows).
- A turntable still needs a phono stage in front of the ADC. Do not plug the cartridge into line-in.
Set input level
On Source, pick Max Input Level for your device (2 dBV typical, 1.8 dBV Pro-class, +17.8 dBV UMC202HD, +19.8 dBV Scarlett 2i2). That only scales the volt labels — set LINE gain on the interface (or in the Windows mixer) so the signal is healthy without clipping.
Performing a 2 dBV calibration is recommended but not mandatory for many measurements and adjustments — see Calibration.
Controls
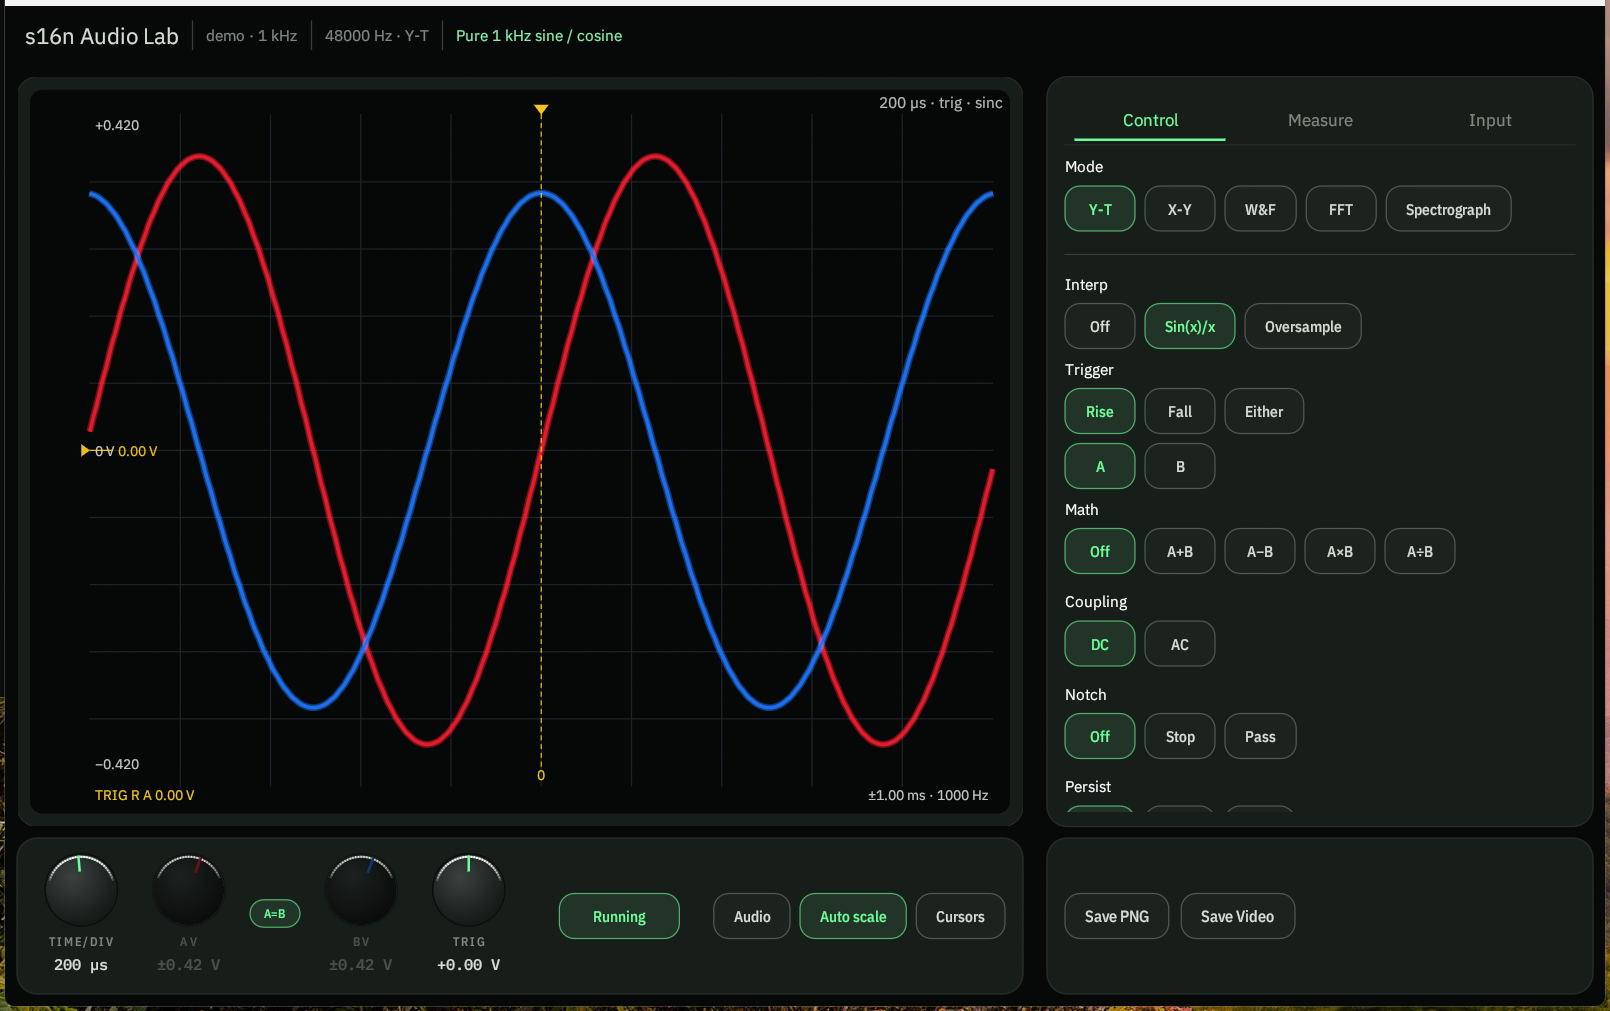
Side tabs on the right: Control · Measure · Source · Tools. Knobs and channel buttons sit in the mid column. Mode buttons and the rest of the Control panel sit on the right. What you get depends on Y-T, X-Y, W&F, FFT, Spectrograph, or Analyzer.
Channels
Click A or B to show or hide that trace. At least one channel stays on. The swatch next to the letter is the channel color — click it to pick a new one.
X-Y forces both on and relabels them X = A and Y = B. W&F reads A only (In = A). Spectrograph uses the Channel row (Mix / A / B / A−B) instead of hiding traces.
Auto scale, Measure, Audio, Cursors
- Auto scale fits the plot to the signal. The Y (or dB range) knob greys out while it is on. Turn Auto off to set the scale yourself — needed when you want A and B on the same volts/div.
- Measure opens the readout: Vpp, RMS, frequency, period, duty, and more. THD is included. Tabs pick A or B (and the math channel when that is on).
- Audio plays the analysed signal through the speakers. It starts off.
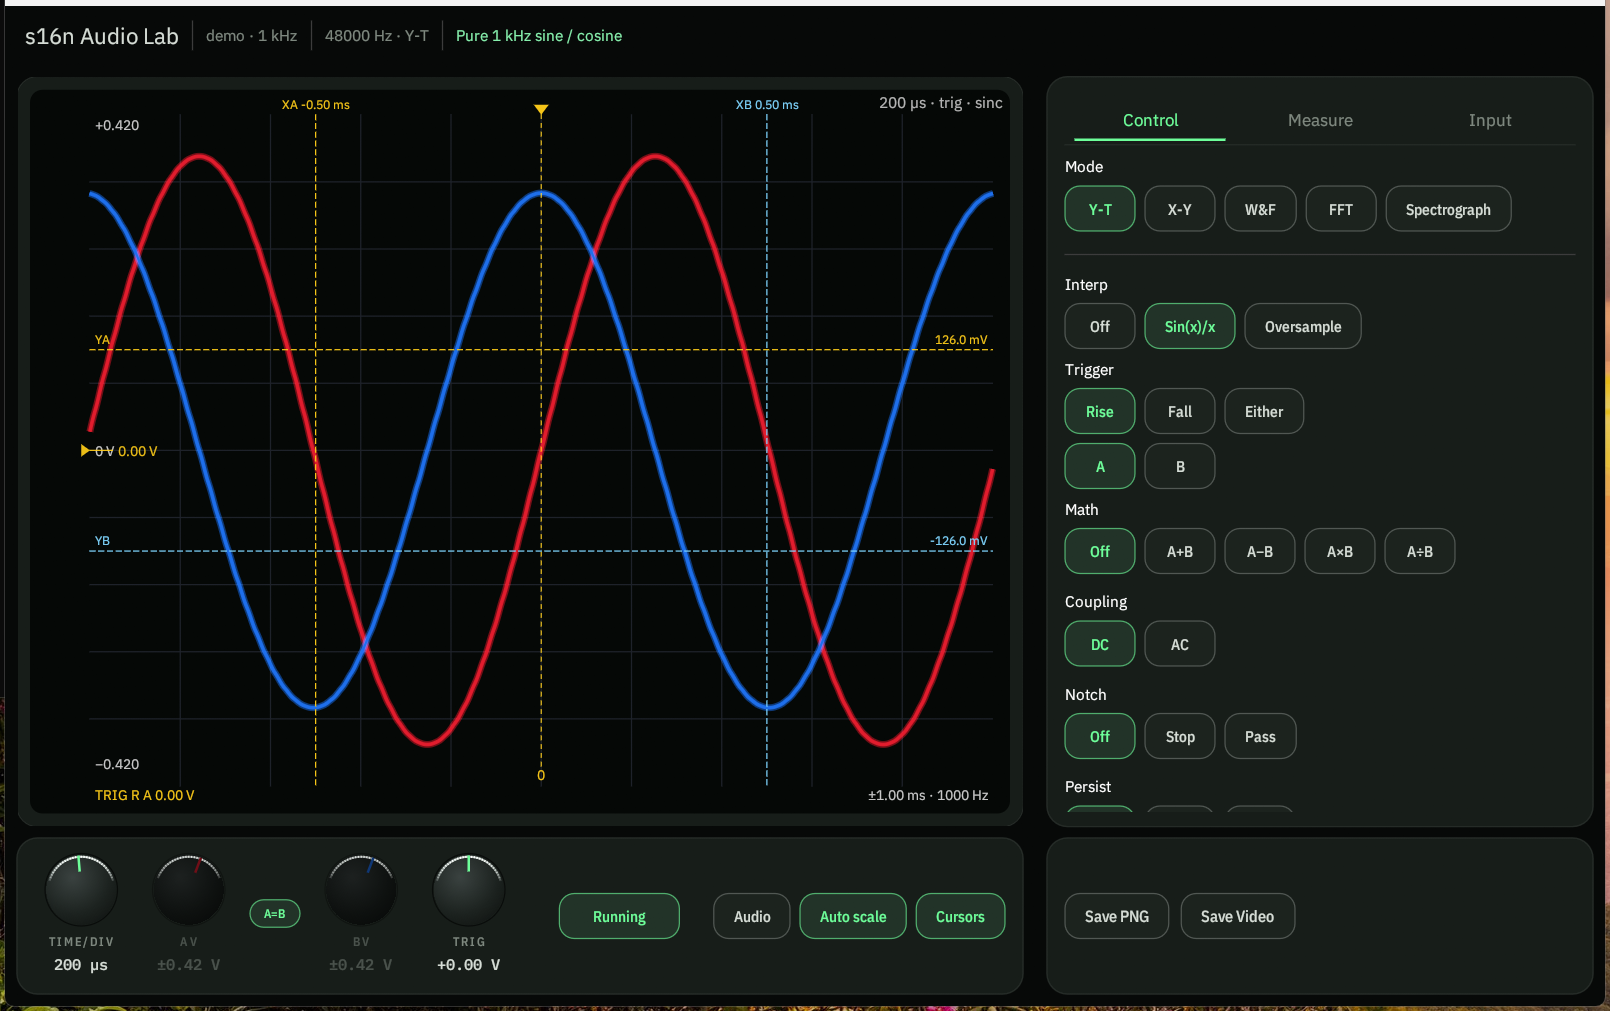
- Cursors — Y-T drops two vertical time cursors; FFT / Spectrograph drop frequency cursors. Drag A and B on the plot. Deltas land in the Measure list.
X-Y swaps Cursors for Phase Aid — a chord that tints green in phase and red when the figure is ≥20° out.
Knobs
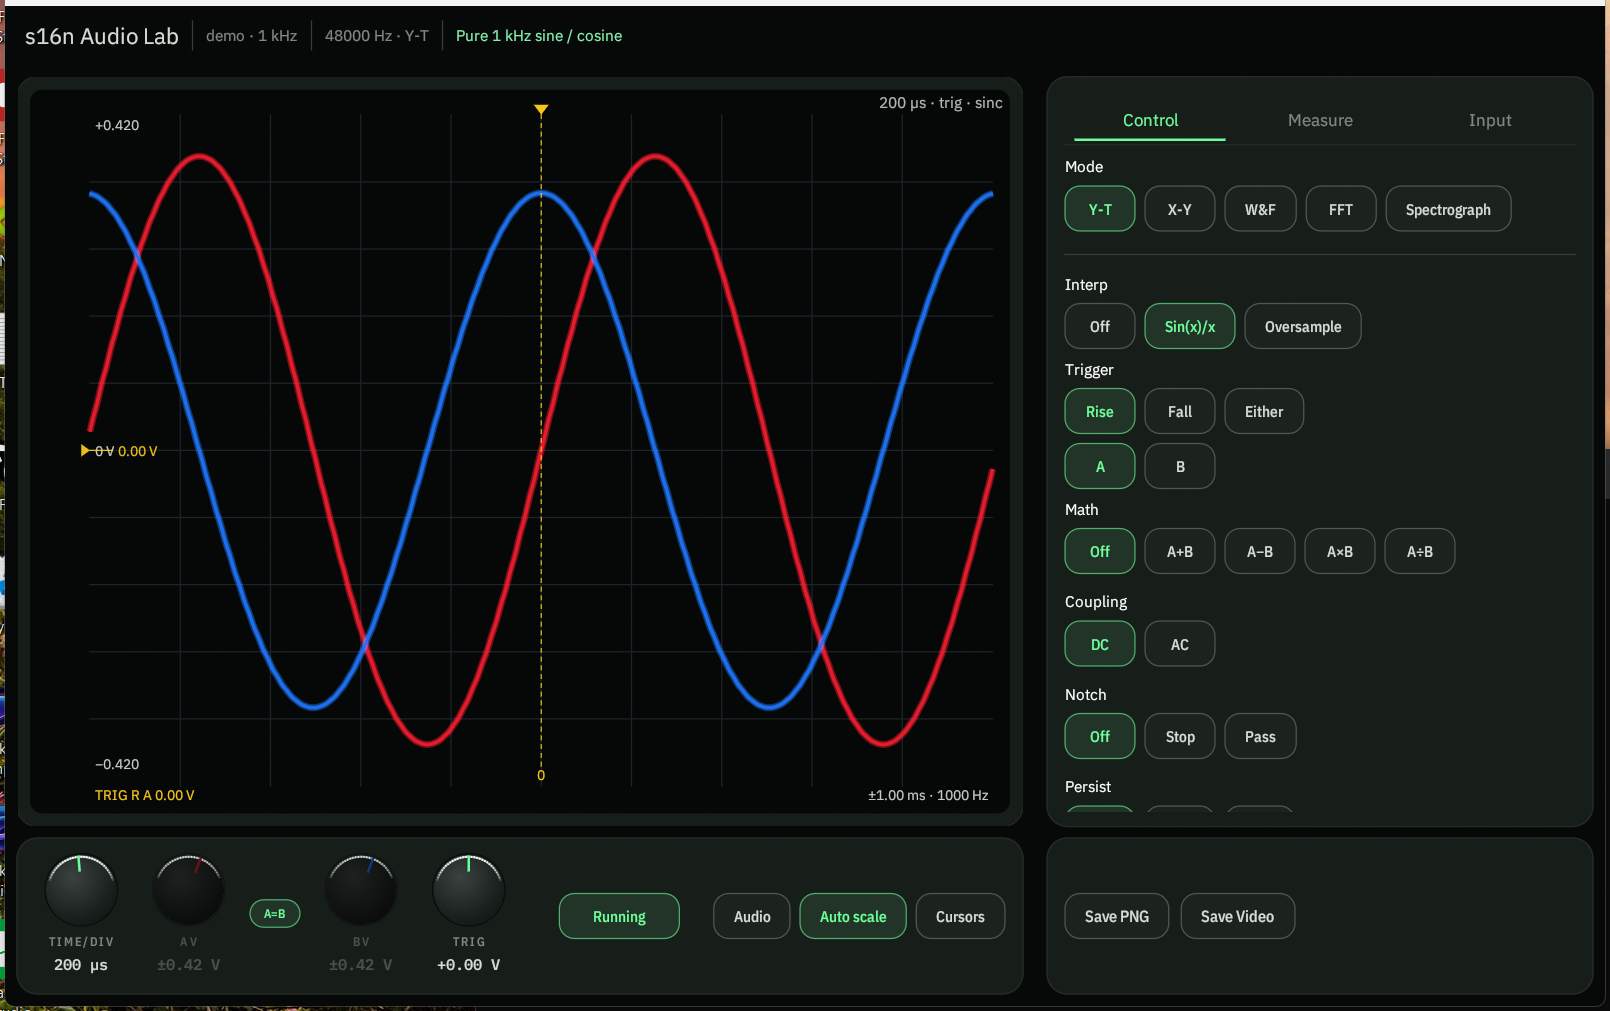
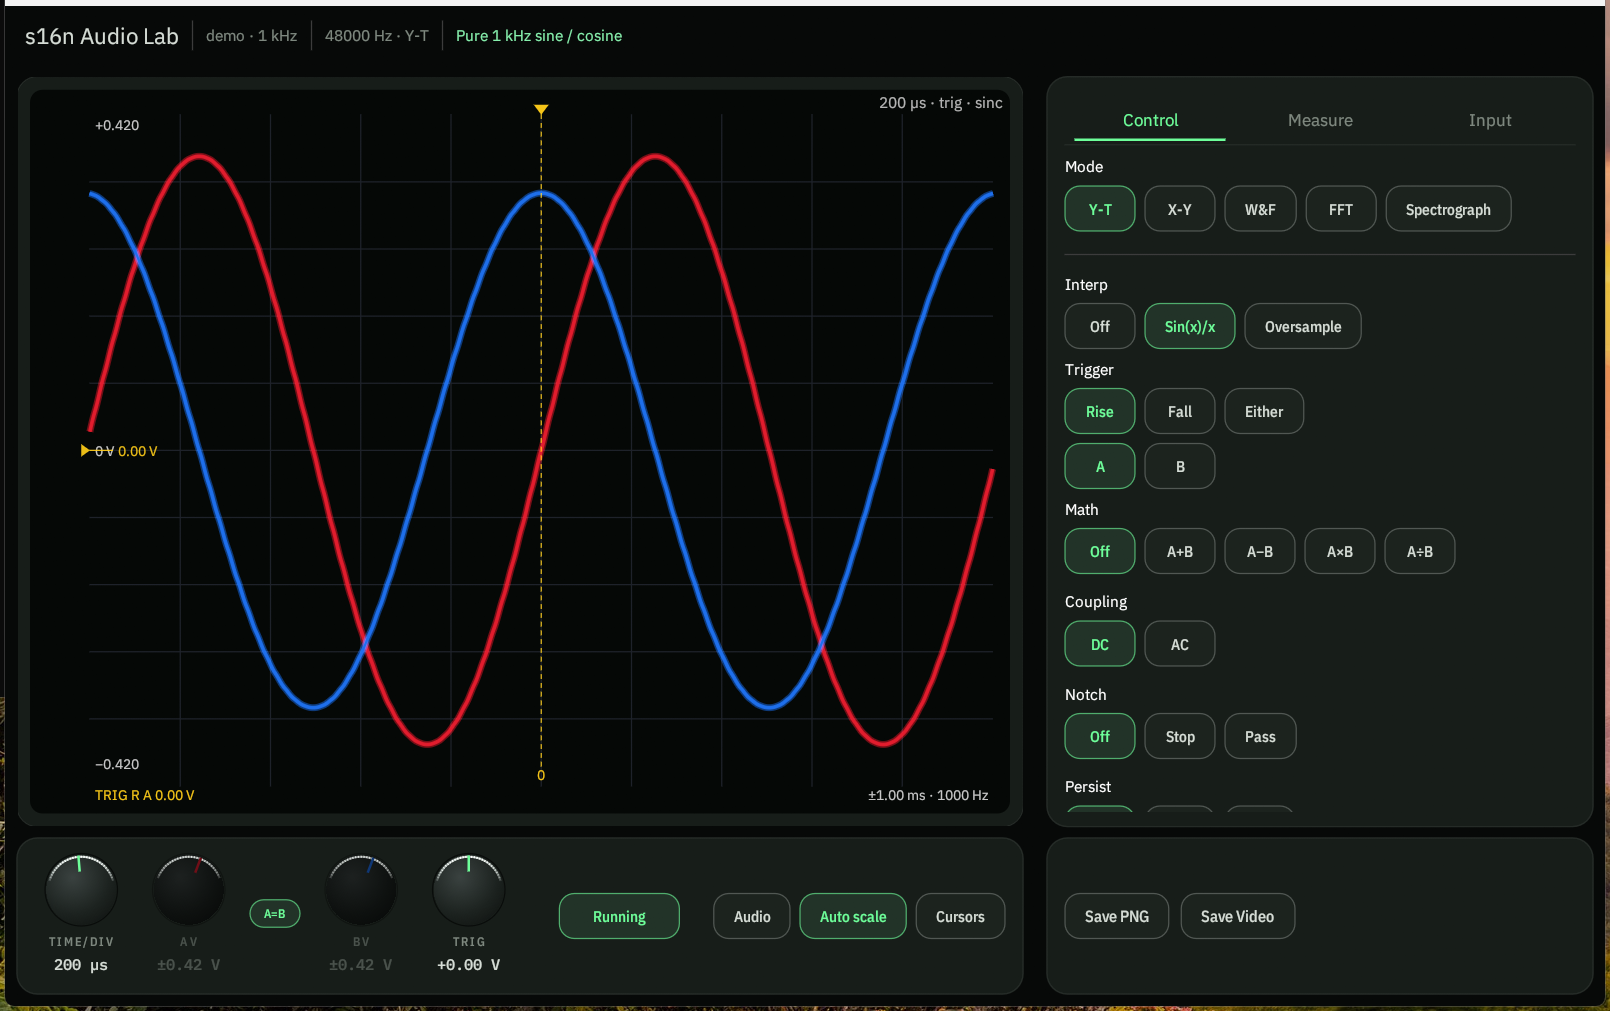
Y-T has four knobs:
- Time / div — shared timebase for A and B.
- A Y (V) — volts per division for A. The padlock locks B’s Y to A.
- B Y (V) — independent B scale when the lock is open.
- Trig level — trigger threshold. On the deck under Auto: Fall / Rise / Both edge, then A / B source.
Click the padlock (Unlock B from A) so B’s Y no longer tracks A. Lock it again to copy A onto B. A math channel other than Off forces A and B back together.
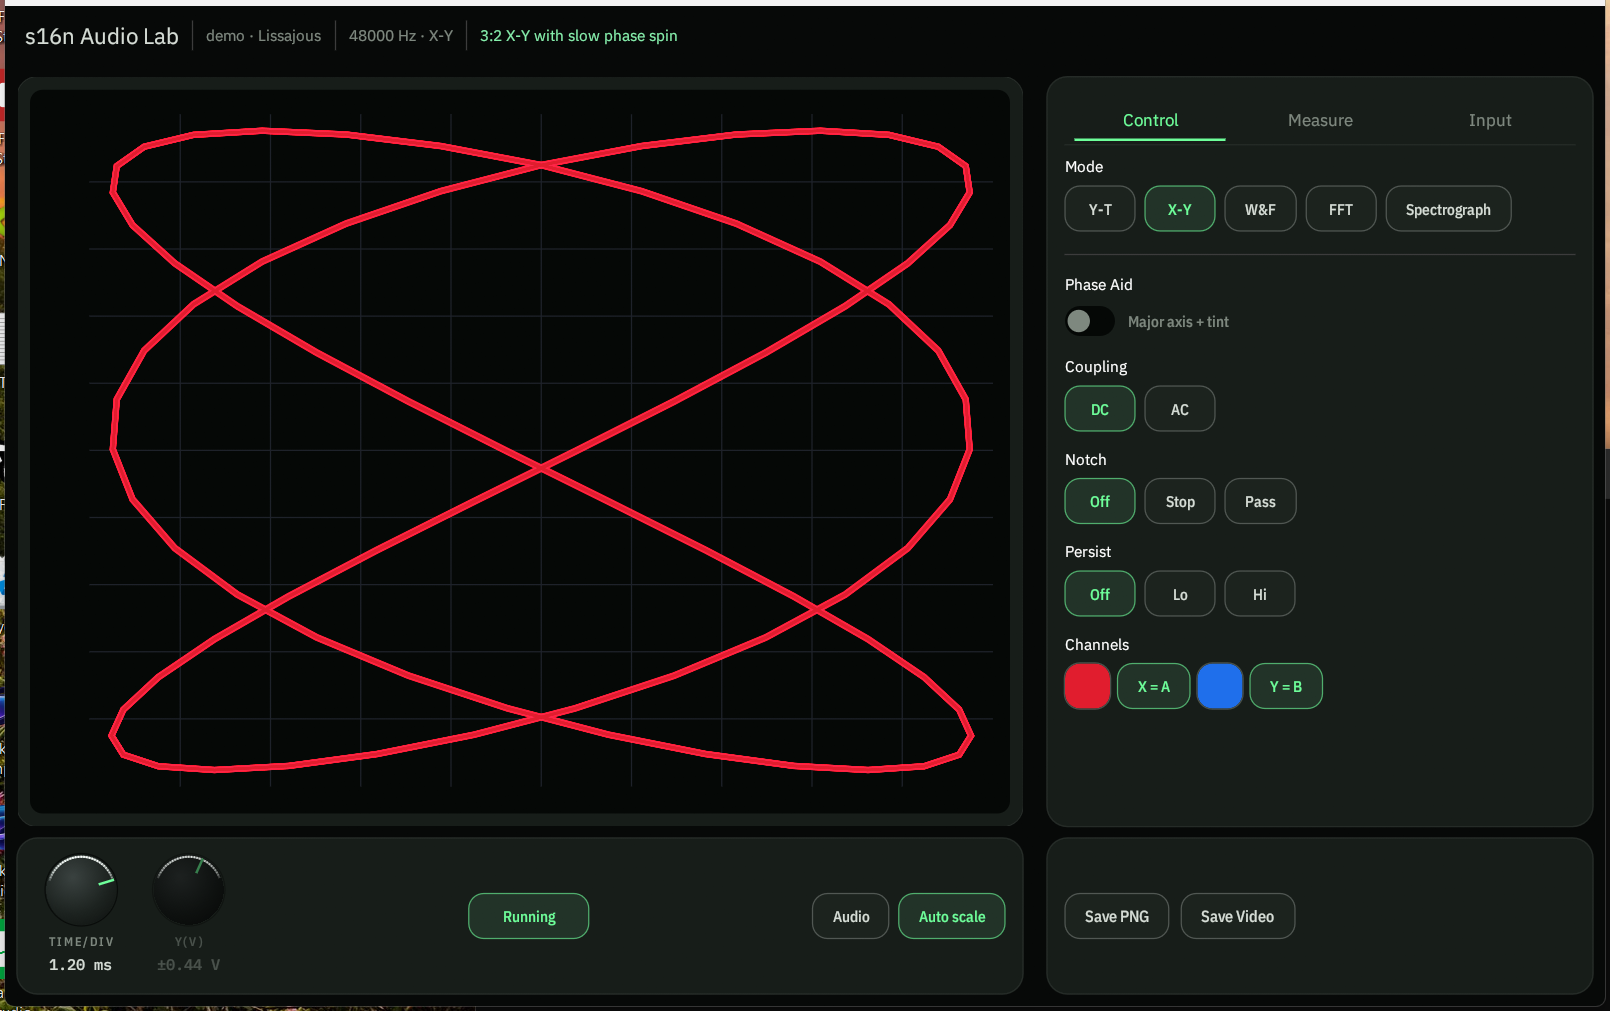
X-Y has one Time / div and one Y (V). No A/B Y lock — A is always X and B is always Y.
FFT and Spectrograph replace time/Y with Max freq (up to Nyquist) and, in dB / Pink EQ, dB range (40–120 dB). In FFT Linear, that second knob is a magnitude scale. Auto scale still owns the Y knob until you turn it off. Spectrograph has no Persist control — it has Y axis, Channel, and Sharp instead.
W&F hides the knobs. Use Standard, Carrier, Eccentricity, and Range % FS on the panel instead.
Coupling
DC keeps any offset. AC strips DC so a small AC signal is not sitting on a rail. Coupling is on every mode except W&F (the meter wants the raw carrier).
Notch
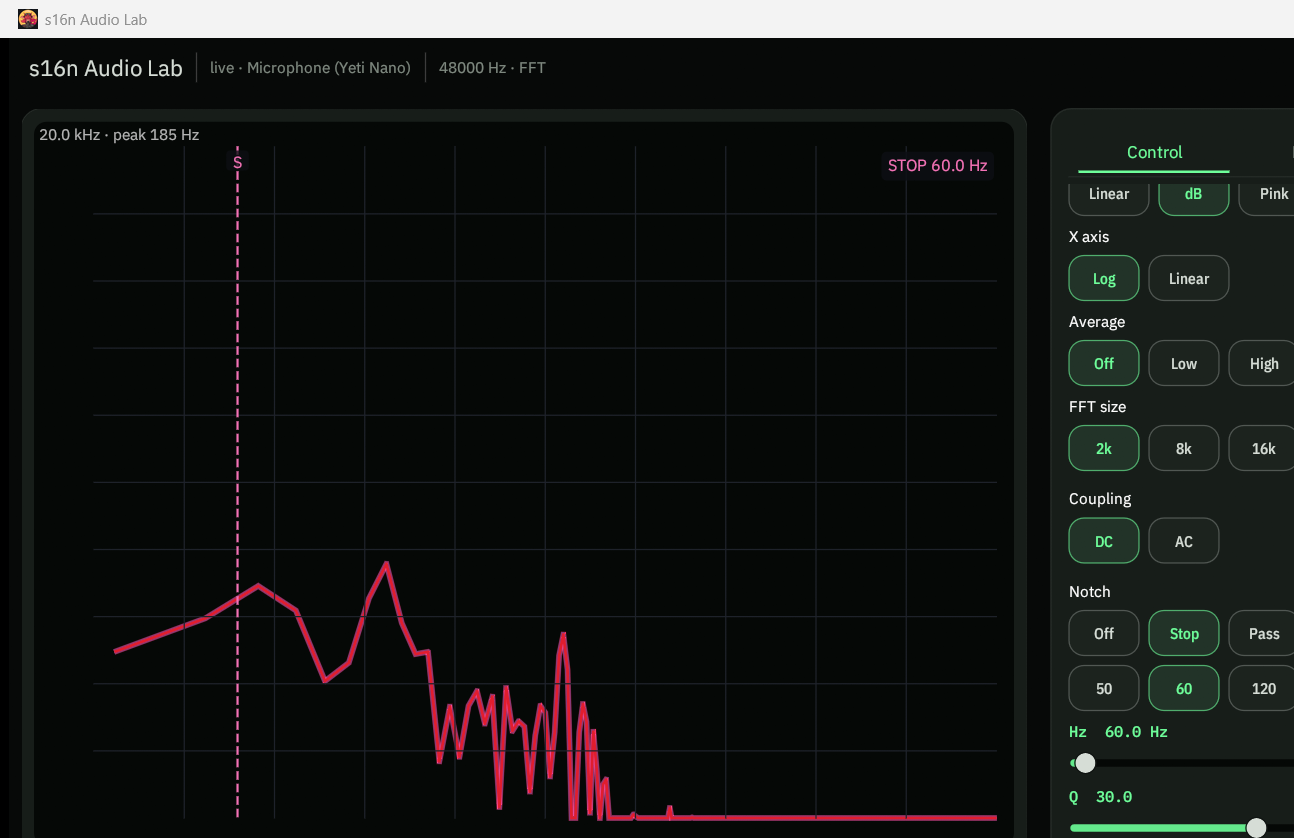
The panel is labeled Notch. Modes: Off, Band-stop, and Band-pass.
- Band-stop cuts a narrow band — 50 / 60 / 120 Hz presets for mains, or drag Freq.
- Band-pass keeps a band and rejects the rest.
- Width is Q. Higher Q is a tighter notch.
Notch is not on W&F.
Persist
Off / Lo / Hi. Hi is the phosphor trail — useful for a drifting Lissajous or a rare glitch. The CD RF eye demo is the clear case: without persist the diamond lattice is hard to see; Persist Hi burns the eye in as traces overlay. Persist is on Y-T, X-Y, and FFT. Spectrograph and W&F do not have it.
Magnitude, X axis, Average, Color grade
FFT-only, above Coupling:
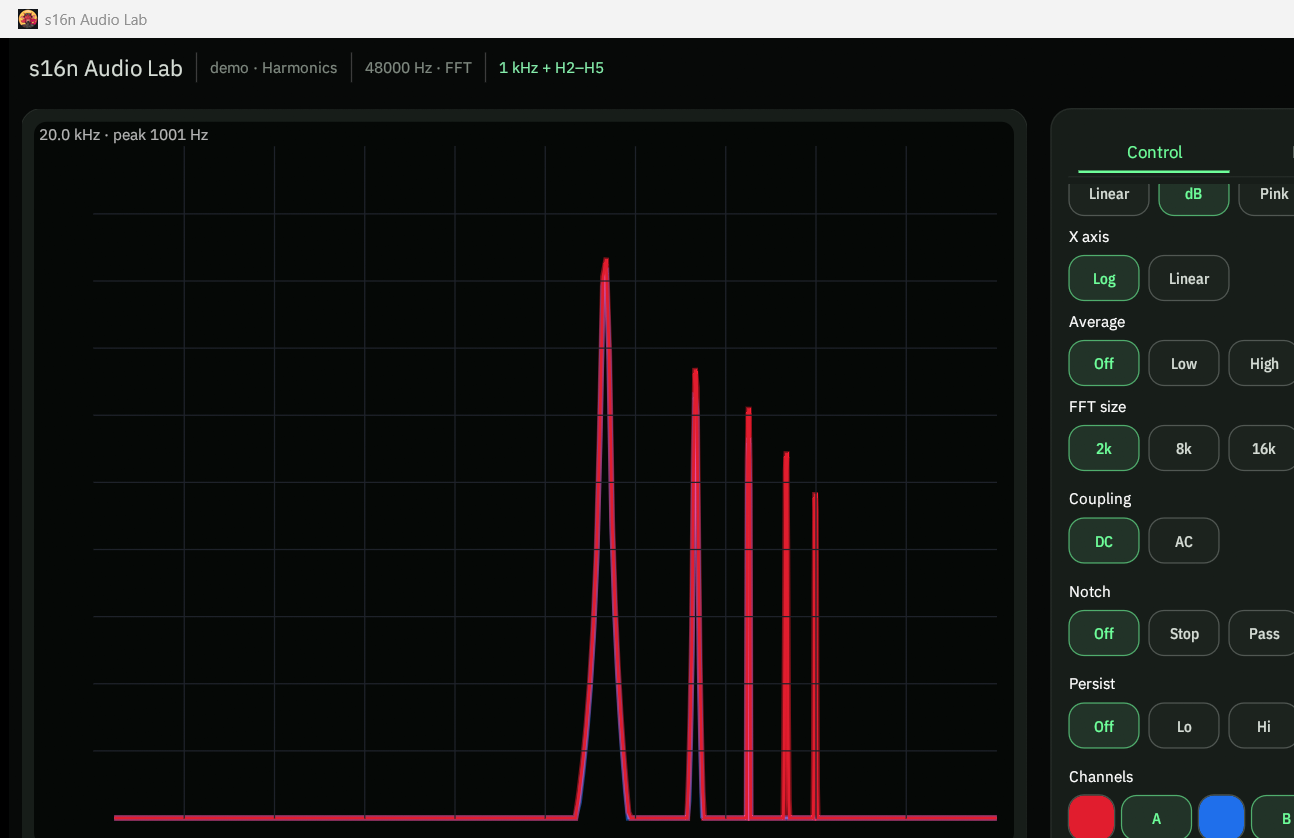
- Magnitude — Linear, dB, or Pink EQ (+3 dB/oct so ideal pink reads flat).
- X axis — Log (20 Hz–max) or Linear (0–max).
- Average — Off (instant), Low, or High (steady pink curve).
- Color grade — DPX-style density fill under the curve. Heat where the spectrum spends time; the live stroke turns off while it is on. Independent of Persist.
- Peak labels — mark spectrum peaks on the plot.
Y-T also has Display interpolation (Off, Sin(x)/x, Oversample) and Math (A+B, A−B, A×B, A÷B). Those sit under Persist.
Spectrograph
Spectrograph-only, above Coupling. Time still scrolls right→left; these pick what the waterfall shows.
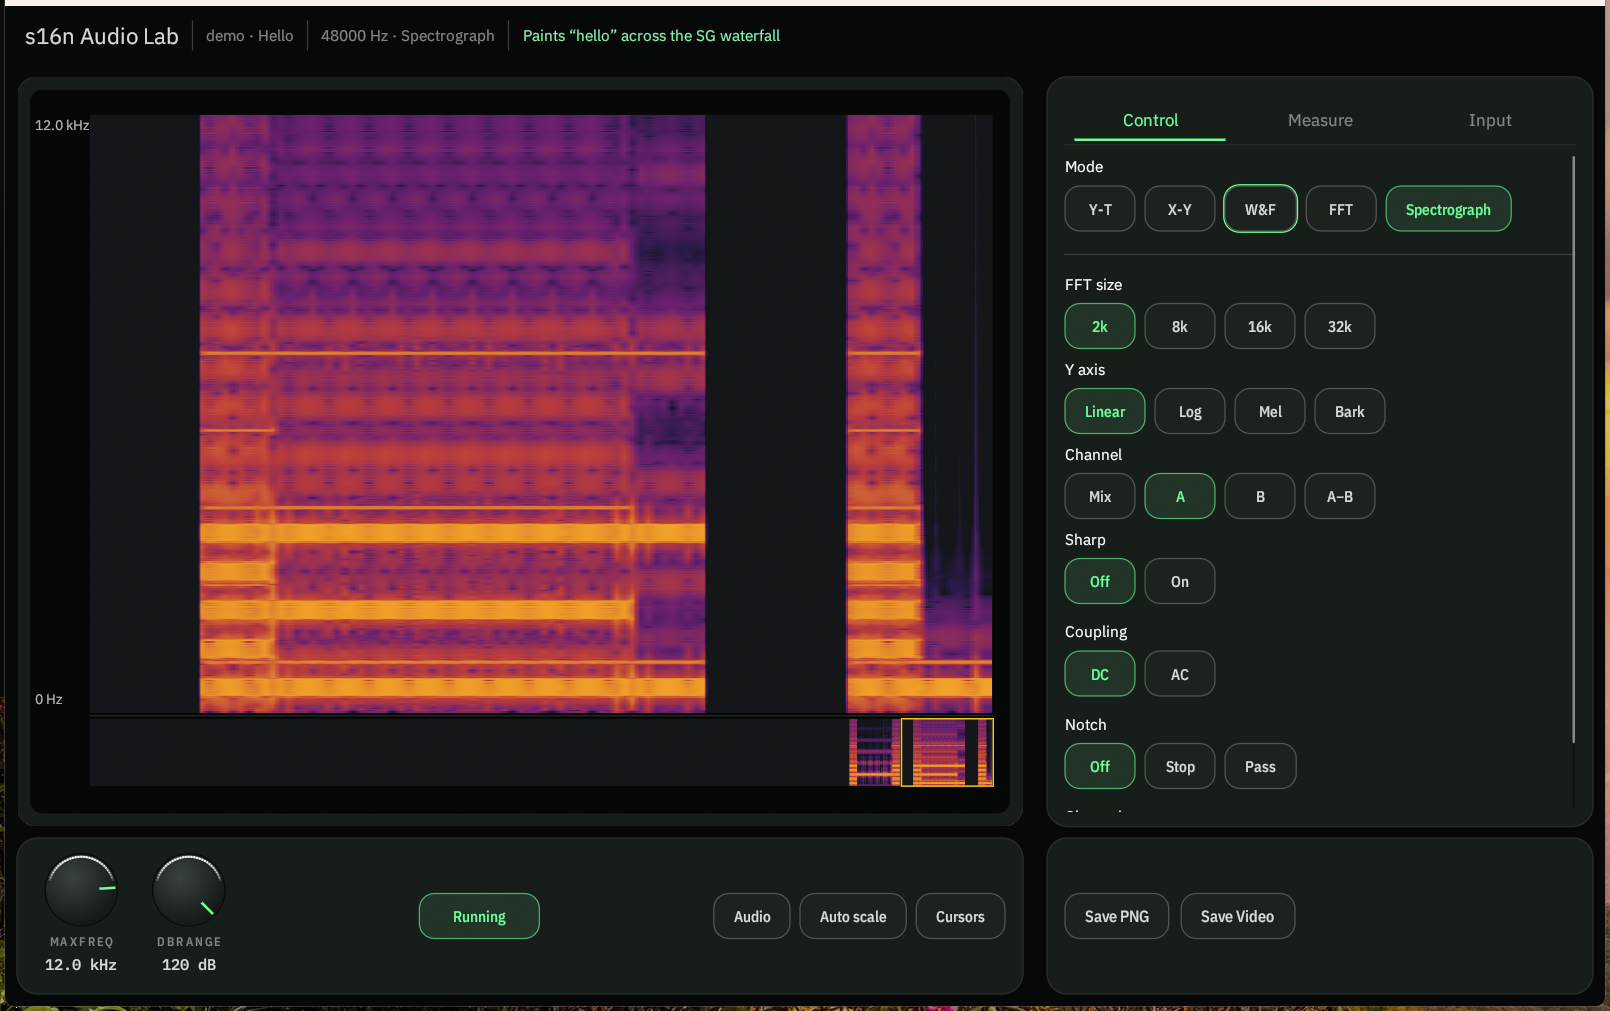
- Y axis — Lin (0–max), Log (20 Hz–max), Mel (denser lows), or Bark (critical bands). Frequency is on Y, not X.
- Channel — Mix (mean of A and B), A, B, or A−B / Diff (diverging colours so a difference stands out).
- Sharp — Off is ordinary magnitude columns. On is frequency reassignment — thinner ridges, less smear.
- Scrub — a 10× overview sits under the plot (~45 s of history). Drag it to move the 4.5 s window. Scrubbing pauses the live scroll; Resume (or P) jumps back to now.
Cursors here are horizontal (frequency). The Hello demo is this view.
Analyzer
Analyzer is an AES17-style meter with a live spectrum. Pick a Test: THD, IMD, Crosstalk, or Dynamic Range. The tool generates the matching stimulus — loop that output into the USB ADC (or the DUT). Measure keeps sticky THD / THD+N / IMD / Xtalk / Dynamic Range rows.
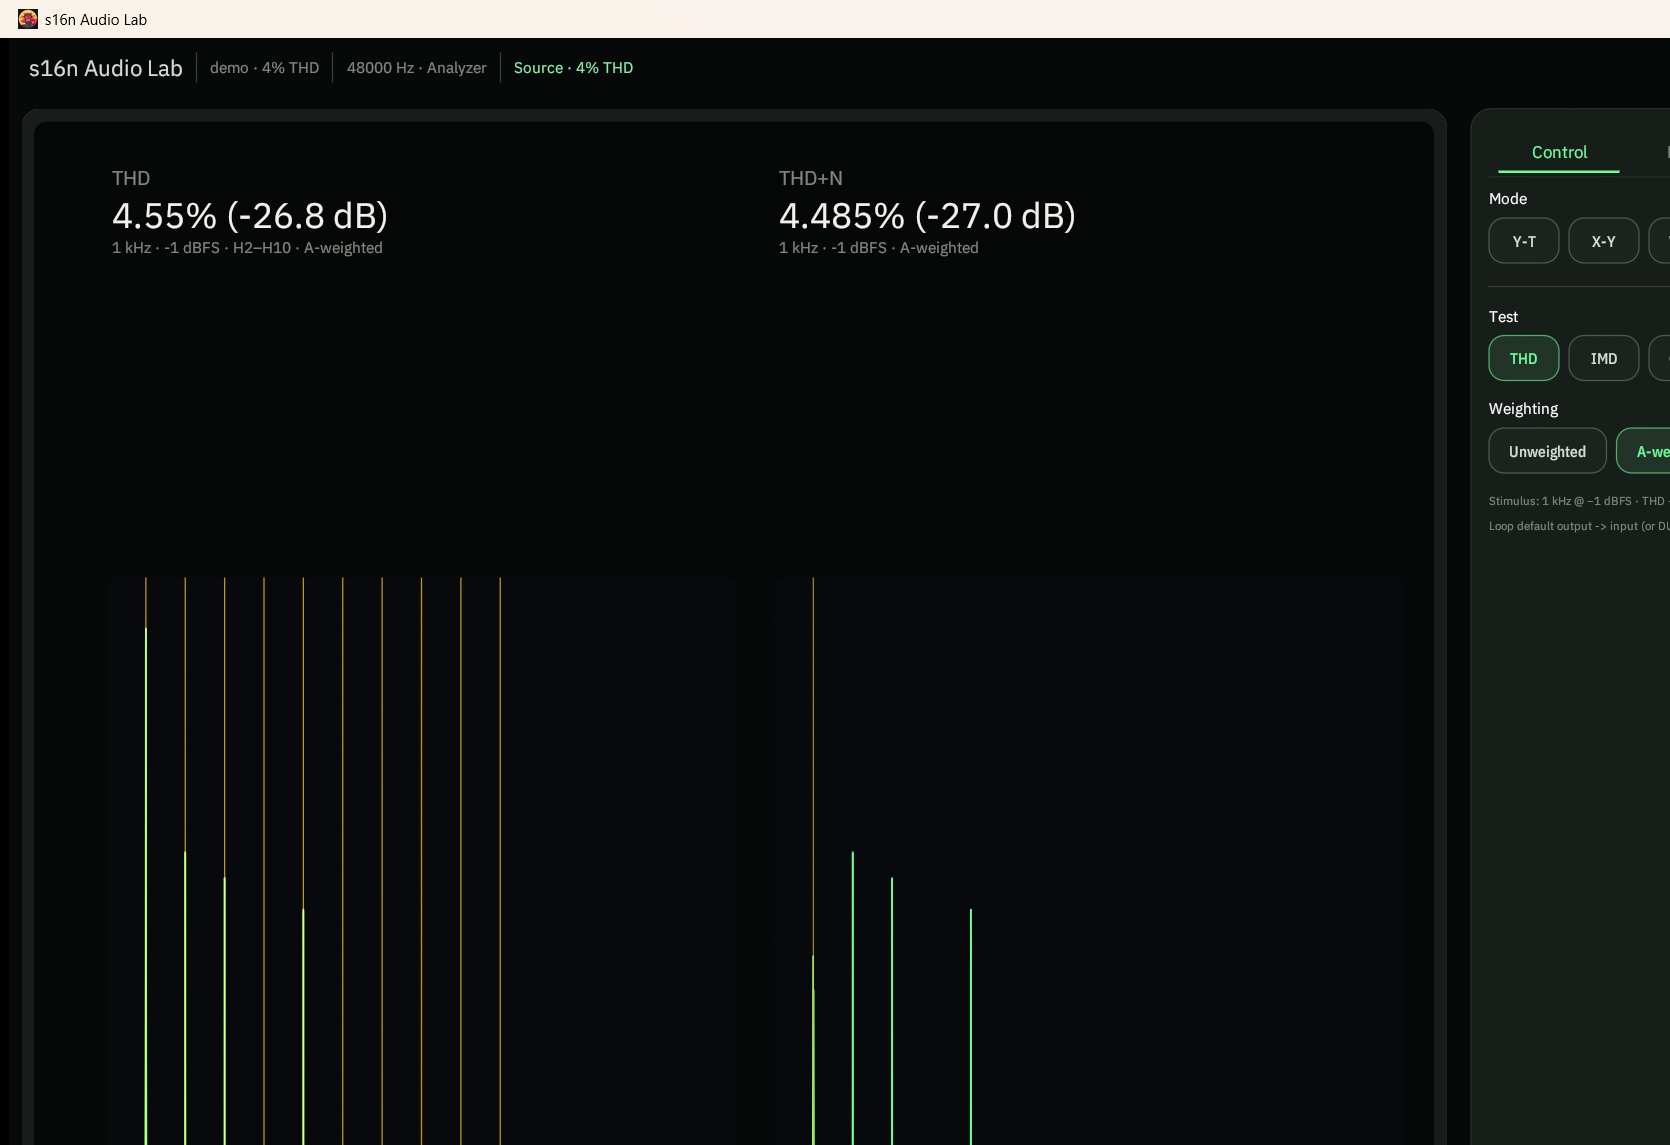
- THD — dual panes: THD and THD+N from 1 kHz @ −1 dBFS. Weighting: Unweighted or A-weighted.
- IMD — SMPTE (60 Hz + 7 kHz, 4:1) or CCIF (19 + 20 kHz; needs ≥44.1 kHz).
- Crosstalk — 1 kHz on one channel; Drive L→R or R→L; quiet/driven in dB at 1 kHz.
- Dynamic Range — AES17: 1 kHz @ −60 dBFS (nearly silent), notched, A-weighted vs digital FS.
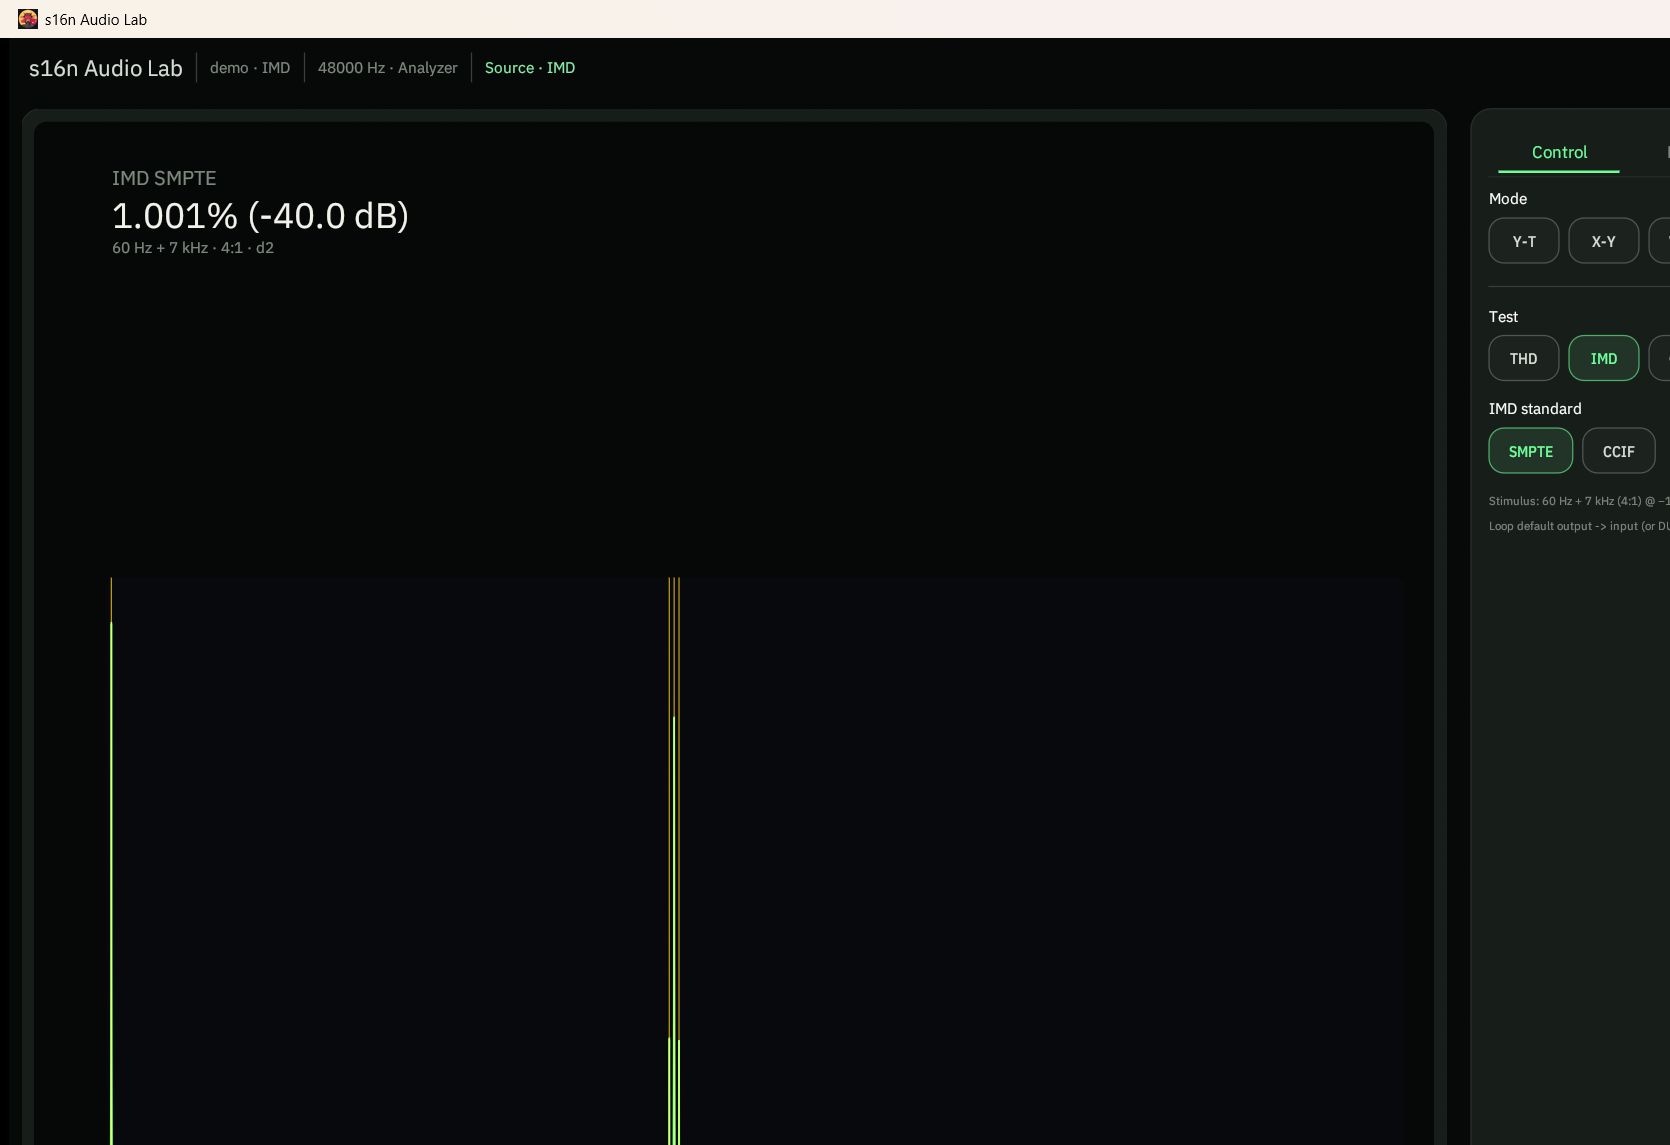
Built-in 4% THD, IMD, and Crosstalk examples open this mode without gear. For vinyl cartridge work the record is the stimulus — see Align cartridge azimuth with crosstalk.
Align tape-head azimuth
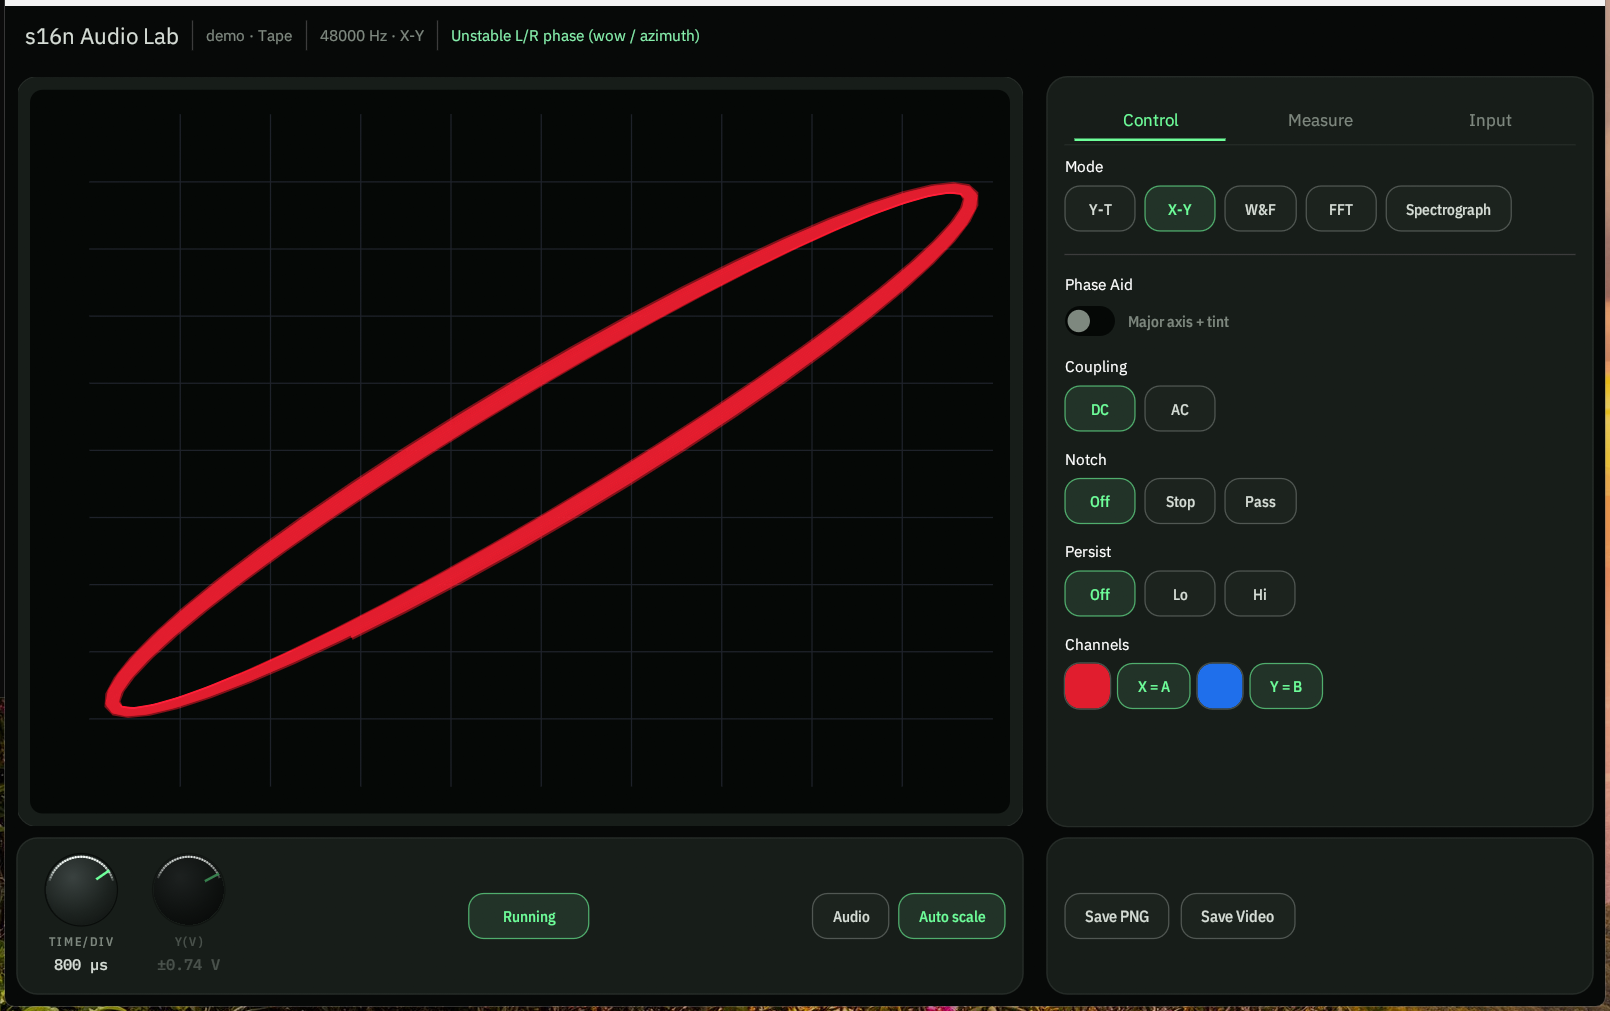
Use a dual-channel azimuth tone on a reference tape — typically 8, 10, or 15 kHz, recorded on both tracks. Turn on Phase Aid — that chord is the setting this check is built around. An FFT / Spectrograph confirm helps too.
- Take the deck’s line outputs into a USB ADC. In Audio Lab, pick that device and Start. Show A and B.
- Play the azimuth section. Switch to X-Y. A is X, B is Y. Auto scale on. Enable Phase Aid.
- Turn the azimuth screw slowly. Aim for a tight, stable line (or a very thin ellipse) with the Phase Aid chord along it. A fat, rotating, or open figure means the head is still off.
- Switch to FFT as a check. Both channels should sit on the same peak; wandering or a washed-out comb means phase is still drifting. Spectrograph shows the same thing over time — the two traces should hold still.
Do this after the tape path is clean and the tape is seated. Recheck at a second frequency on the tape if it has one. The Tape wobble demo is this view without a deck.
Check tape wow & flutter
Use the W&F section of a reference tape: 3.15 kHz for DIN / CCIR, or 3 kHz for JIS / NAB. Standards: DIN, JIS, NAB, CCIR, AES 2σ, and unweighted — use the one printed on the tape.
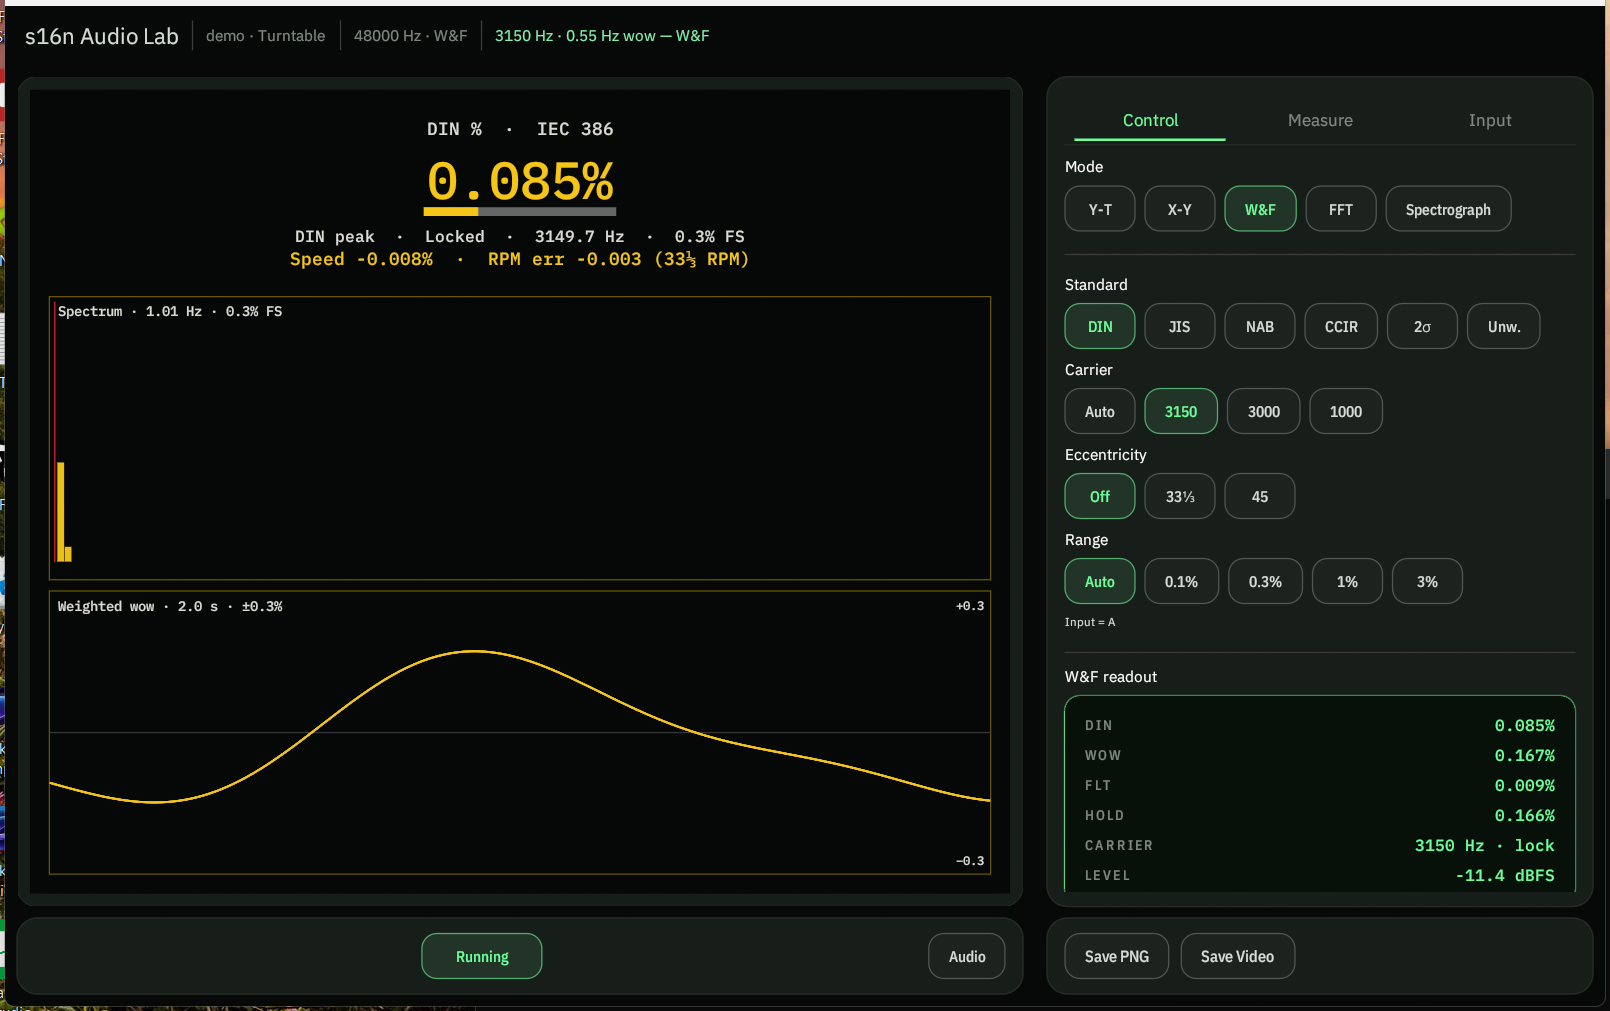
- Line out from the deck into the USB ADC. Start Audio Lab and switch to W&F. The meter reads channel A only — hide B if it is noisy.
- Play the tone. Set Standard to DIN (or the standard that matches the tape). Set Carrier to 3150 (DIN / CCIR) or 3000 (JIS / NAB). Leave Eccentricity Off — that notch is for turntables.
- Wait until Seek locks and the W&F, wow, and flutter readouts settle. Use hold / 5 s average if the number is bouncing.
- Compare the reading to the deck’s spec. A high wow (low-rate) number usually means capstan or belt; high flutter is more scrape, roller, or motor cogging.
Level should be healthy on the meter. If Lock never appears, the tone is too quiet or the wrong frequency.
Check turntable wow & flutter
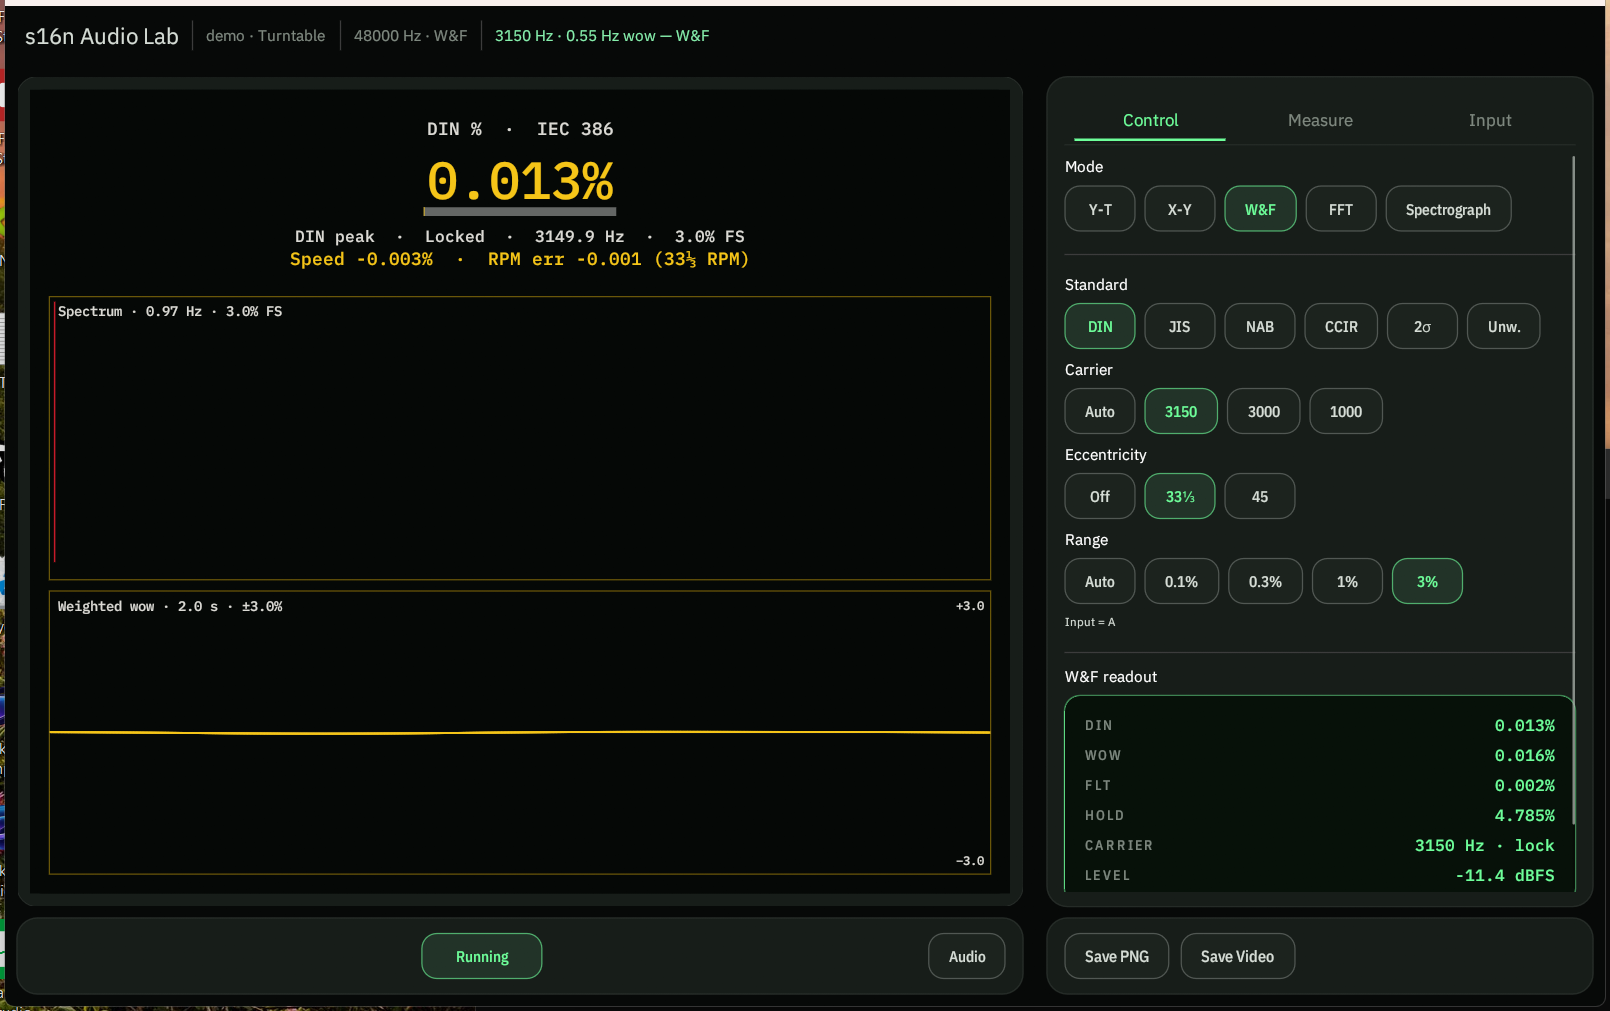
Use a test record with a 3.15 kHz (DIN / CCIR) or 3 kHz (JIS / NAB) tone. Some discs also have 1 kHz. Set Eccentricity to 33 or 45 so once-per-rev wow from an off-center hole is notched out.
- Phono stage into the USB ADC. Start Audio Lab and switch to W&F. The meter reads channel A only.
- Play the tone at 33 or 45 as marked on the disc. Set Standard to DIN (or the standard that matches the record). Set Carrier to 3150, 3000, or 1000 Hz.
- Set Eccentricity to 33 or 45. Leave it Off if you want that eccentricity in the number.
- Wait for Seek to lock. Speed % and RPM error show under the main readout when the carrier is held. Use hold / 5 s average if the value is moving.
- Compare W&F, wow, and flutter to the table’s spec. High wow is usually platter, belt, or a warped disc; high flutter is more motor cogging or a dirty bearing.
The Turntable wow demo is a 3150 Hz tone with 0.55 Hz wow — Eccentricity 33 is the recommended setting on that.
Check turntable frequency response
Use a test record with a pink-noise band, through a phono stage, into the USB ADC. Set Pink magnitude EQ. For a vinyl cut, use Log X and Average High so bass and treble share the plot and the curve settles.
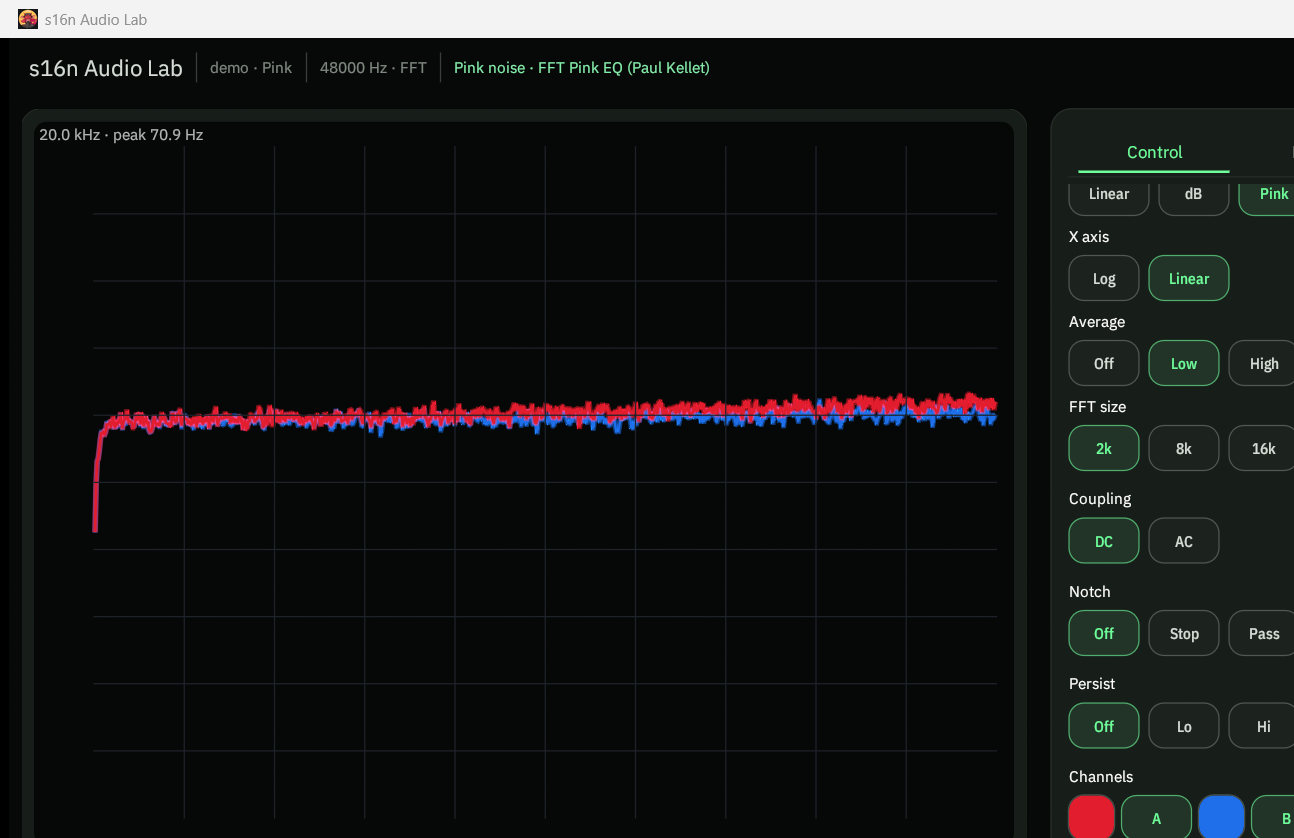
- Start Audio Lab on that input. Switch to FFT. Show A and B.
- Set Magnitude to Pink EQ (+3 dB/oct). Ideal pink then reads flat. For a record, set X to Log and Average to High and wait for the curve to settle.
- Play the pink-noise band at a typical tracking force. Auto scale on, or fix dB range so both channels share a scale.
- A flat-ish pair of traces is the cartridge + arm + preamp response after RIAA. Look for channel mismatch, a rising or falling treble tilt, a bass hump (arm/cartridge resonance), or a suck-out. Switch Magnitude to dB if you want the raw −3 dB/oct pink slope instead.
The Pink noise demo starts the same FFT + Pink EQ path without a record (Linear X, Average Low). Switch to Log / High when you want the vinyl-style view.
Set turntable anti-skate
Use a test record with a tracking / anti-skate band (a loud 300 Hz tone is common) or a silent, unmodulated groove. Tracking force should already be set. THD is the readout to watch — it should stay matched on A and B. An FFT confirm helps too.
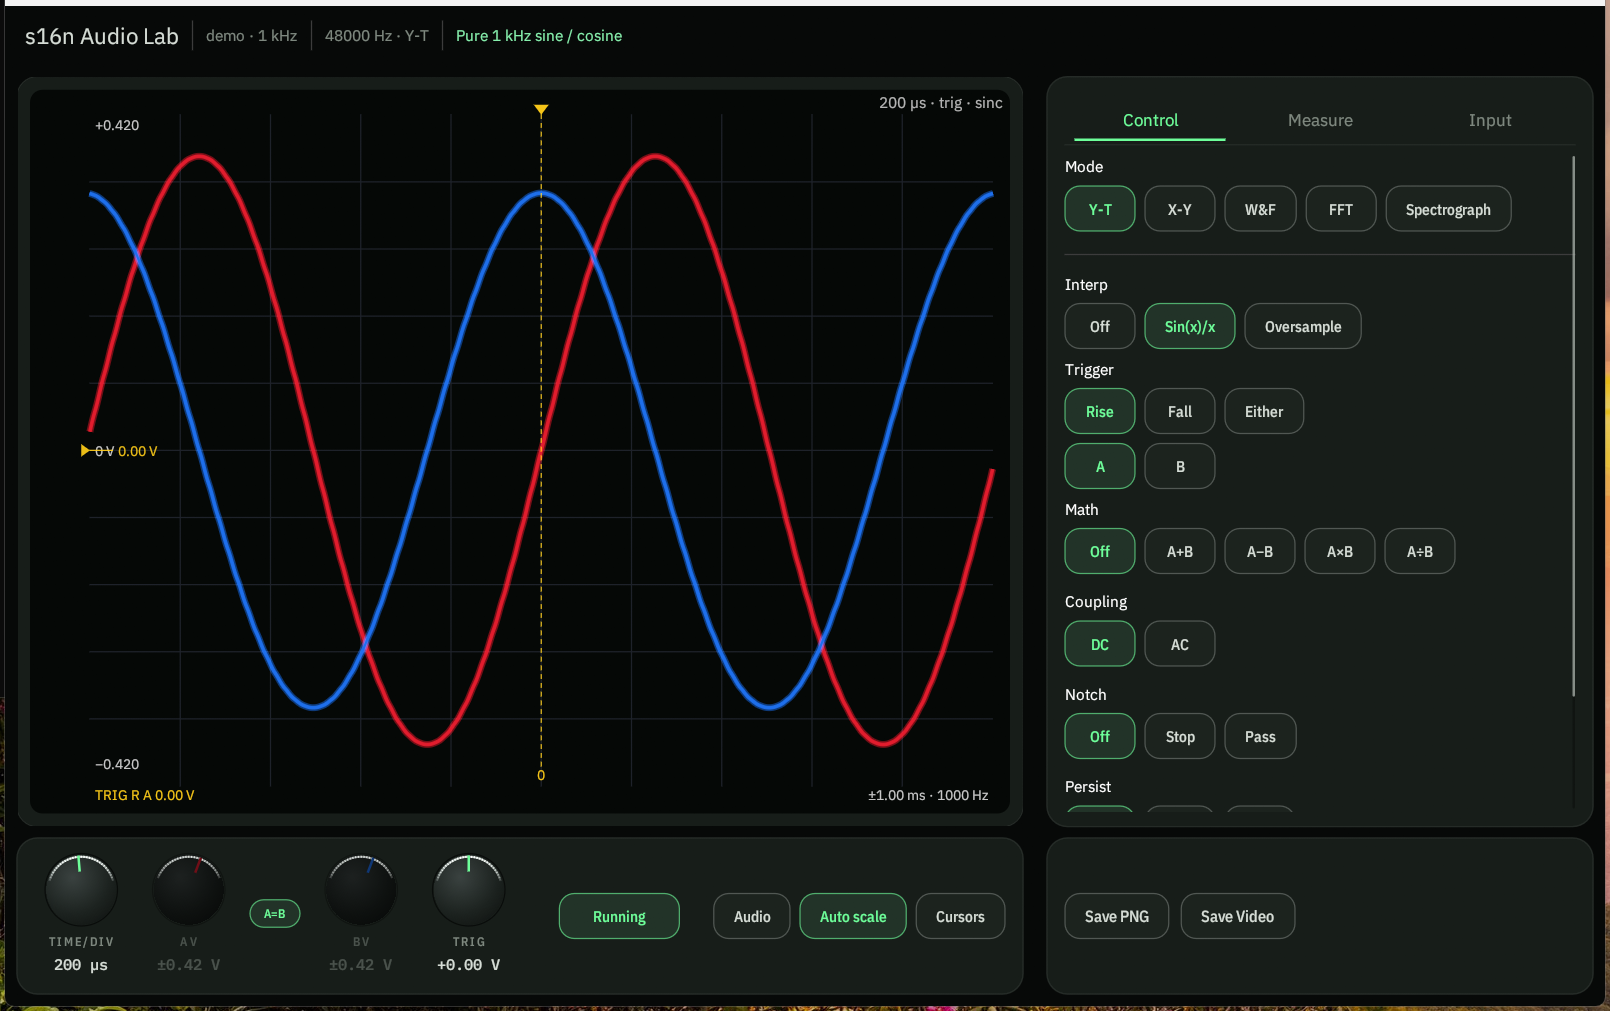
- Phono stage into the USB ADC. Start Audio Lab. Show A and B (A is left, B is right if the ADC is wired that way).
- Play the tracking band. Switch to Y-T. Auto scale on. Measure on. A clean tone is a steady pair of sine waves. Mistracking is a sudden spike, a collapsing edge, or hash on one channel — and THD jumping on that side only.
- Switch to FFT as a check (dB, Log X, Average Off). Both channels should share one peak and the same harmonic stack. Extra broadband junk or one channel’s harmonics jumping means that side is losing the groove.
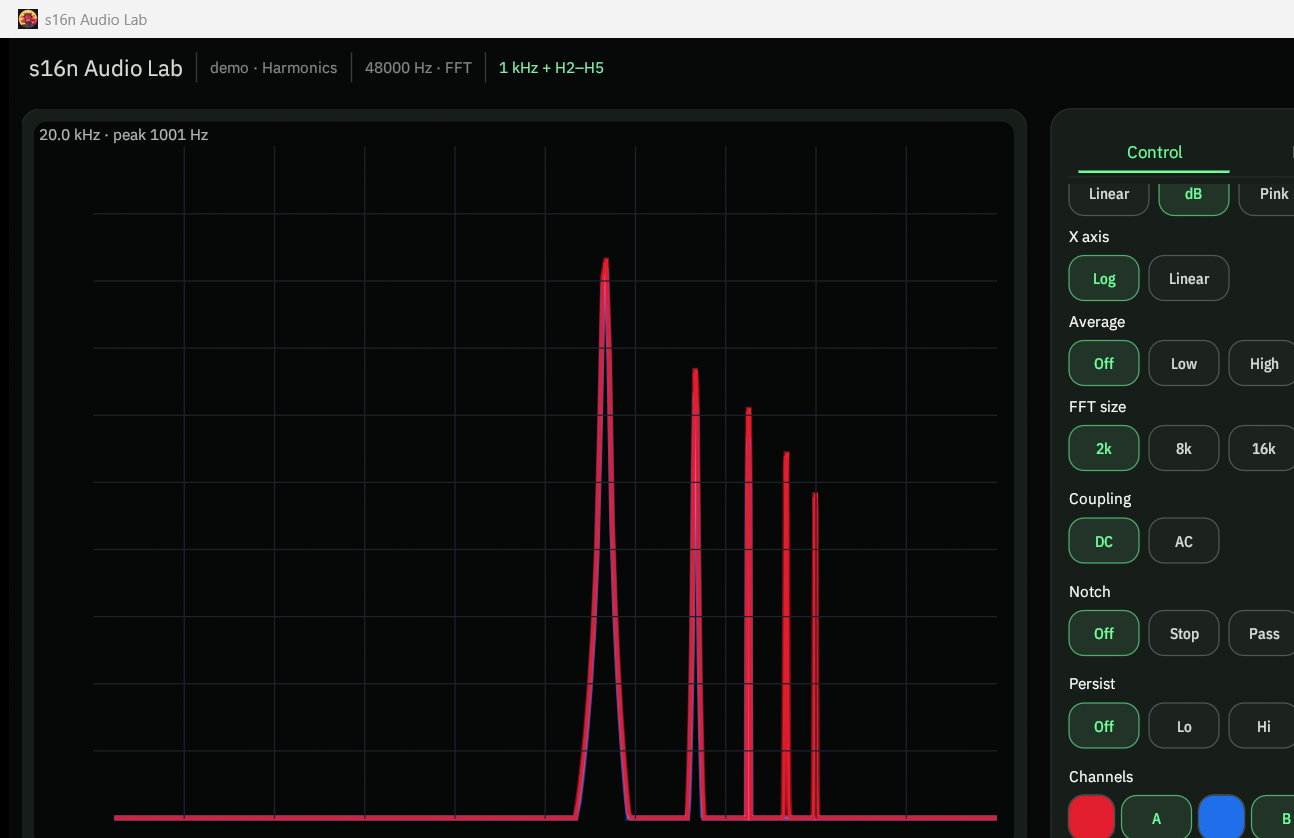
- Turn anti-skate until A and B break up together — or neither does at that level. Too little anti-skate usually dirties B (outer / right wall) first; too much dirties A (inner / left). If the disc has an inner-groove band, recheck there — skating force is highest toward the label.
A silent groove is a cruder check: the arm should sit still, and Y-T / FFT noise should look similar on A and B. Do not chase a steady midband level offset with anti-skate — that is channel balance.
Align cartridge azimuth with crosstalk
Stylus azimuth (headshell twist) sets how much of a left-only groove bleeds into the right channel, and the other way around. Analyzer → Crosstalk meters that leakage in dB at 1 kHz — more negative is better separation. Use a test record with left-only and right-only (or vertical / lateral single-wall) bands. Tracking force and anti-skate should already be set.
Practice first with the built-in Crosstalk example (fixed −40 dB L→R leak) so you know what the meter looks like.
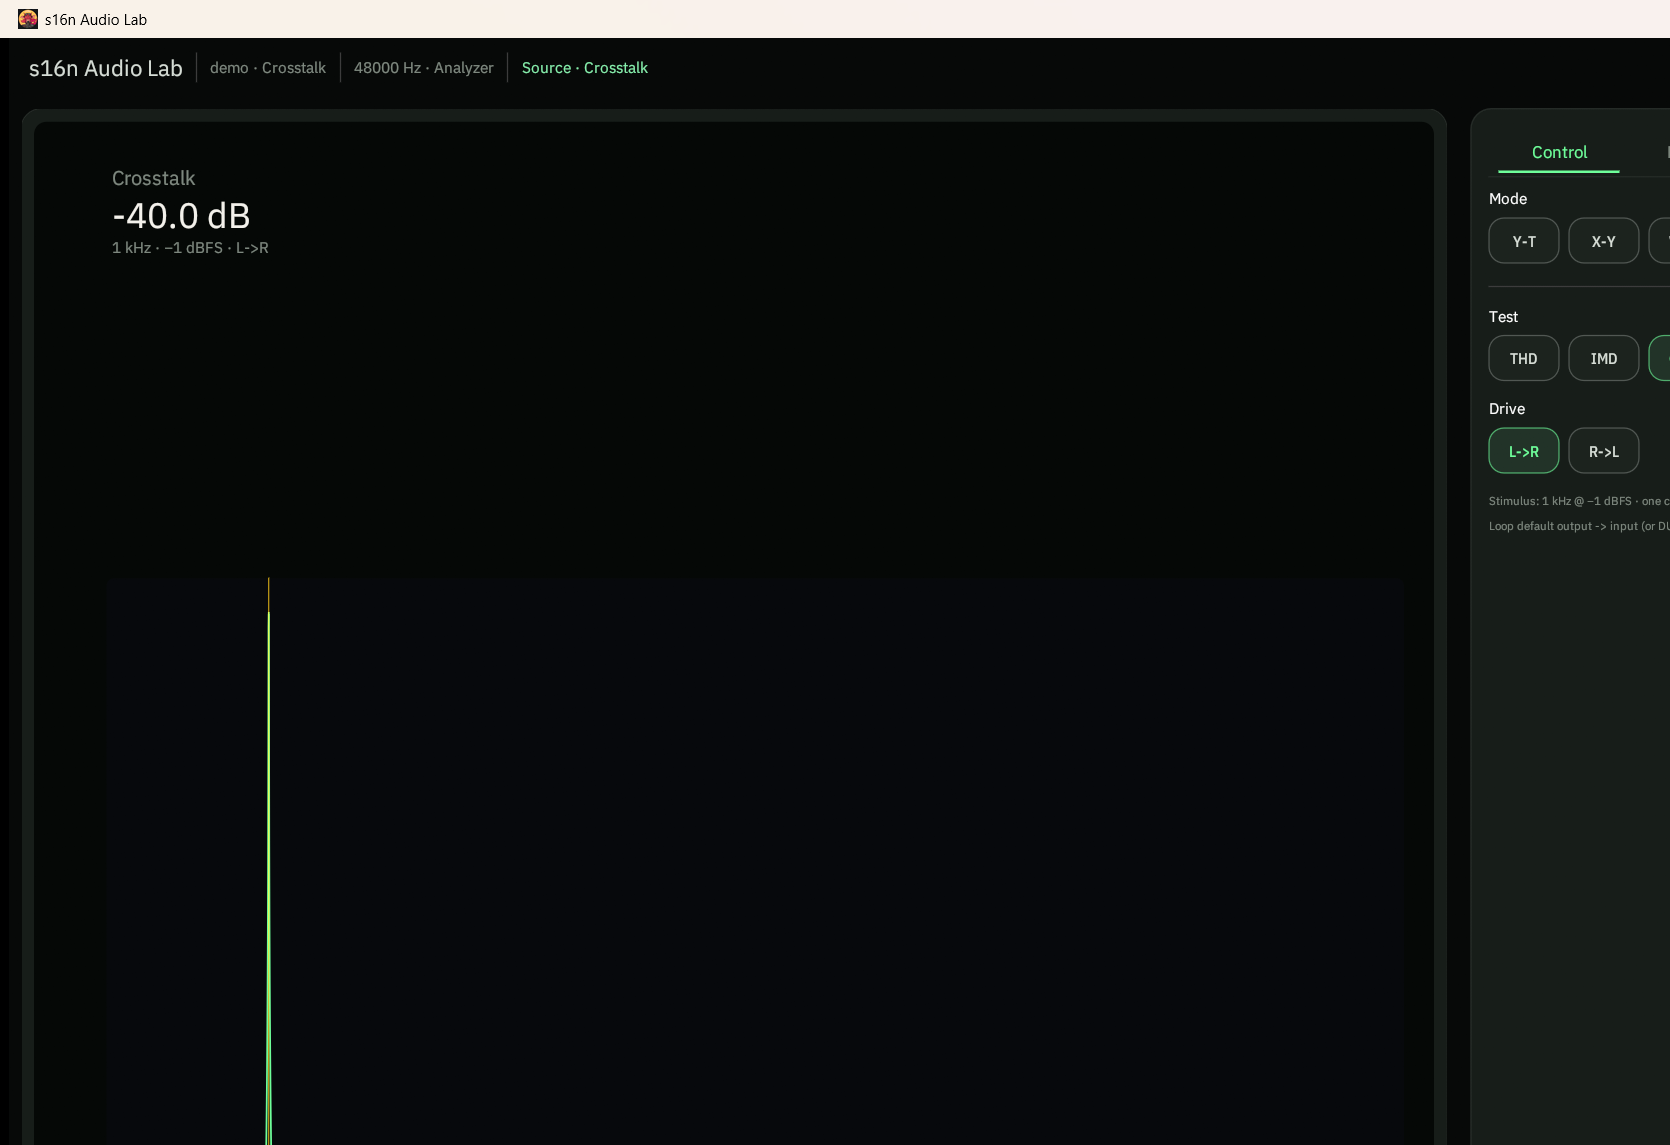
- Phono stage into the USB ADC. Source → Live, pick that device. Show A and B (A = left, B = right if the wiring matches).
- Switch to Analyzer. Set Test to Crosstalk. For vinyl the record is the drive — do not loop the app’s Tools / analyzer tone into the ADC; leave playback unconnected to the inputs (or muted into the room).
- Play the left-only band. Set Drive to L→R. The big readout is quiet/driven at 1 kHz (R vs L). Wait until it settles.
- Nudge headshell azimuth a fraction at a time. Watch the dB number — aim for the most negative reading (e.g. −25 dB is better than −15 dB). Too little twist and the quiet channel climbs; go past the null and it climbs again.
- Play the right-only band. Set Drive to R→L. Repeat. A good setup is roughly matched both ways — chasing one side into the weeds usually hurts the other.
- Optional confirm: X-Y with Phase Aid on a lateral / L+R tone should look tight once azimuth is close; crosstalk is the finer meter for single-channel bands.
Cartridge and phono crosstalk floor out somewhere (often the mid −20s to −30s dB on vinyl, better on electronics). Stop when both directions peak and the headshell is snug. Recheck channel balance afterward — azimuth can shift midband levels a little.
Check cassette channel balance
Use the 400 Hz or 1 kHz reference on a cassette test tape, or a tone recorded equally on both tracks. Midband, so azimuth is not the whole story. Y-T with Auto off and the RMS / Vpp readouts, or an FFT peak compare.
- Deck line out into the USB ADC. Start Audio Lab. Show A and B.
- Play the tone. Y-T with Auto off so both traces share a scale, or read RMS / Vpp on each channel. Switch to FFT and compare the two peaks in dB.
- A few tenths of a dB is normal. Around 1 dB or more is worth chasing: playback balance, record-level pots, or head height. If the midband matches but the highs do not, go back to azimuth.
A commercially recorded cassette can sanity-check a deck, but the tape itself may already be unbalanced.
Check turntable channel balance
Use a 1 kHz (or other midband) band on a test record, through a phono stage, into the USB ADC. Prefer a lateral / L+R tone so both walls are driven the same. Same Y-T setup as the cassette check — Auto off, read RMS / Vpp. FFT works too.
- Start Audio Lab on that input. Show A and B.
- Play the tone at a typical tracking force. Y-T with Auto off, or read RMS / Vpp. FFT with both traces — the peaks should sit on top of each other.
- A few tenths of a dB is typical cartridge scatter. A steady 1 dB or more is cartridge, wiring, or the phono stage — not anti-skate. If only the highs disagree, check stylus azimuth and the frequency-response how-to above.
Pink-noise FFT (Pink EQ, Log X, Average High) shows the same imbalance across the band if you do not have a 1 kHz cut.
Tools
The Tools tab is a tone generator on the default playback device — useful for a known stimulus into a loopback, a tape deck record path, or another ADC under test. It does not change live input gain.
- Level — digital tone level relative to DAC full scale: 0 dB, −10 dB, or −20 dB (readout is peak dBFS).
- Frequency — Off, 3 kHz, 3150 Hz, 10 kHz, 1 kHz, Sweep (20 Hz ↔ 20 kHz log, 10 s each way), Pink (forces Level to −20 dB), or Custom (drag Hz).
- Start / Stop — open or close the tone stream on the default output.
Prefer −10 dB or −20 dB into gear that clips near line level; leave 0 dB for a full-scale check or the Calibration steps below.
Matched sample rates (Windows)
USB interfaces (UMC202HD and similar) run capture and playback on one clock. Windows keeps a separate shared format for Recording and for Playback. If those rates disagree — for example Recording at 192 kHz and Playback at 44.1 kHz — Live input can open fine, but Tools → Start or Analyzer → Start fails with a backend error (0x88890008 / unsupported format). The box cannot do both rates at once.
Set both sides to the same rate before loopback, tone into the DUT, or Analyzer stimulus:
- Right-click the speaker icon → Open Sound settings → Sound Control Panel (or run
mmsys.cpl). - Playback tab → your interface (e.g. Speakers (UMC202HD 192k)) → Properties → Advanced → choose the sample rate (e.g. 24 bit, 48000 Hz or 24 bit, 192000 Hz). Apply / OK.
- Recording tab → the same interface (e.g. Microphone (UMC202HD 192k)) → Properties → Advanced → the same rate and bit depth. Apply / OK.
- Restart Audio Lab (or click Live again) so it reopens at the new shared format.
48 kHz on both sides is enough for most purposes. Use 96 / 192 kHz only when you need the extra bandwidth — and keep Playback and Recording matched.
Calibration
Performing a 2 dBV calibration is recommended but not mandatory for many measurements and adjustments. It makes the volt / dBV readouts match a known line level when you are setting gains or calibrating meters.
Calibrate output to 2 dBV
The tone Level is digital only (0 dB = 0 dBFS on the DAC). Analog level is set on the interface — an RMS voltmeter on the line out does the real check. Aim for +2 dBV at full-scale digital (Level 0 dB).
- Set the interface output gain to max (or to the fixed line-out you will always use).
- On Tools, set Level to 0 dB and Frequency to 1 kHz. Start.
- Measure the analog output with a true-RMS voltmeter. +2 dBV is 1.259 Vrms (≈ 1.26 V).
- If the meter already reads ~1.26 Vrms, you are done. If it is off, trim the interface output gain until the meter hits ~1.26 Vrms. Leave that gain alone afterward so a Level 0 dB tone stays at +2 dBV.
After that, drop Level to −10 dB or −20 dB for everyday stimulus so you are not driving gear at full scale.
Calibrate input to 2 dBV
Same idea on the capture path: Max Input Level is “what dBV is 0 dBFS on this ADC?” — it scales the Y-T / Measure volt labels. It does not change Windows or hardware gain by itself.
- Finish the 2 dBV output cal above (tone at Level 0 dB, 1 kHz, ~1.26 Vrms on the meter).
- On Source, set Max Input Level to 2 dBV. Pick Live and the USB ADC.
- Loop the output back into the input, and use the Tools tab to output 1 kHz (Level 0 dB, Start).
- Switch to Y-T, open Measure, read RMS. In the Windows sound mixer, open the recording device for that ADC and adjust its input level until RMS shows about 1.26 V (and the sine is not flat-topped). At Max Input Level 2 dBV, that readout means the loopback is sitting at digital full scale — input cal matches the output cal.
Keep the LINE pad on; do not use mic gain for this. If you cannot reach 1.26 Vrms without clipping, the interface’s max input is below +2 dBV at that pad — pick a different Max Input Level preset to match a measured full-scale, or pad the loopback.
Input sample trim
Some USB ADCs deliver B one sample late or early versus A. That looks like a fat X-Y ellipse on a mono tone, or A and B not stacking on Y-T, even when the source is identical.
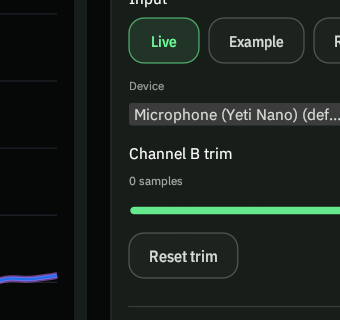
- Open the Source tab. Pick the USB device (Live).
- Channel B trim is −10…+10 samples. 0 is no shift. Positive delays B; negative advances B. Reset trim returns to 0.
- Connect one output from a source to both ADC inputs (Y-split or two leads from the same jack). Switch to X-Y. A perfect match is a tight 45° line. An open ellipse means the channels are skewed — adjust trim until the figure collapses to a line.
The UCA202 / UCA222 often wants −1. Do not assume that. Other interfaces are usually 0. The only 100% check is that one-output-into-both-inputs X-Y line.
MCP
Drive Audio Lab from an AI agent (Cursor, Claude Desktop, Claude Code) or any localhost HTTP client. Feature overview is on the product page.
- Start the desktop app. On Tools, turn MCP → SERVER ON (listens on
127.0.0.1:18765). - Point the client at the stdio bridge that ships with the app (
lab_help,lab_get,lab_measure,lab_set,lab_source,lab_tone,lab_capture). - Loop the Tools tone into the ADC (or use a live / demo source) so measures can lock onto frequency.
Custom tone frequencies are plain Hz strings ("2000", "2500"). Presets also work (1k, 3k, 3150, 10k, sweep, pink). Levels: 0, -10, -20. Analyzer patches: display_mode: "analyzer", analyzer_test (thd · imd · xtalk · dr), analyzer_imd (smpte · ccif), analyzer_xtalk (ltor · rtol).
Example: Spectrograph → Y-T tone check
Ask the agent something like:
Switch to Spectrograph, play a 2 kHz tone, wait until it is detected, show the readouts, and capture a PNG. Then switch to Y-T, change the tone to 2.5 kHz, wait until that is detected, show the readouts, capture again, and stop the tone.
A typical tool sequence:
lab_set—display_mode: "sg"(optionallysg_peak_labels: true).lab_tone—action: "start",freq: "2000",level: "-10"(or"0"if you have headroom).- Poll
lab_measureuntil the tone shows up — on Spectrograph checksg_peak_labels/peak_hznear 2000 Hz; on Y-T / FFT usemeasure.freq_hzwithmeasure.valid_freq. lab_measureagain and report the readouts (Vpp, RMS, freq, peaks).lab_capture—format: "png".lab_set—display_mode: "yt".lab_tone—action: "configure",freq: "2500"(tone stays running).- Poll
lab_measureuntil frequency settles near 2500 Hz. lab_measure→ show readouts;lab_capture→format: "png".lab_tone—action: "stop".
Keep the app in the foreground for PNG captures (they grab the painted plot). If lab_* fails with connection refused, MCP is off or the app is not running.
Was this page useful?